

 CFP
CFP
Energy Autonomy: A Shield Against Global Shocks
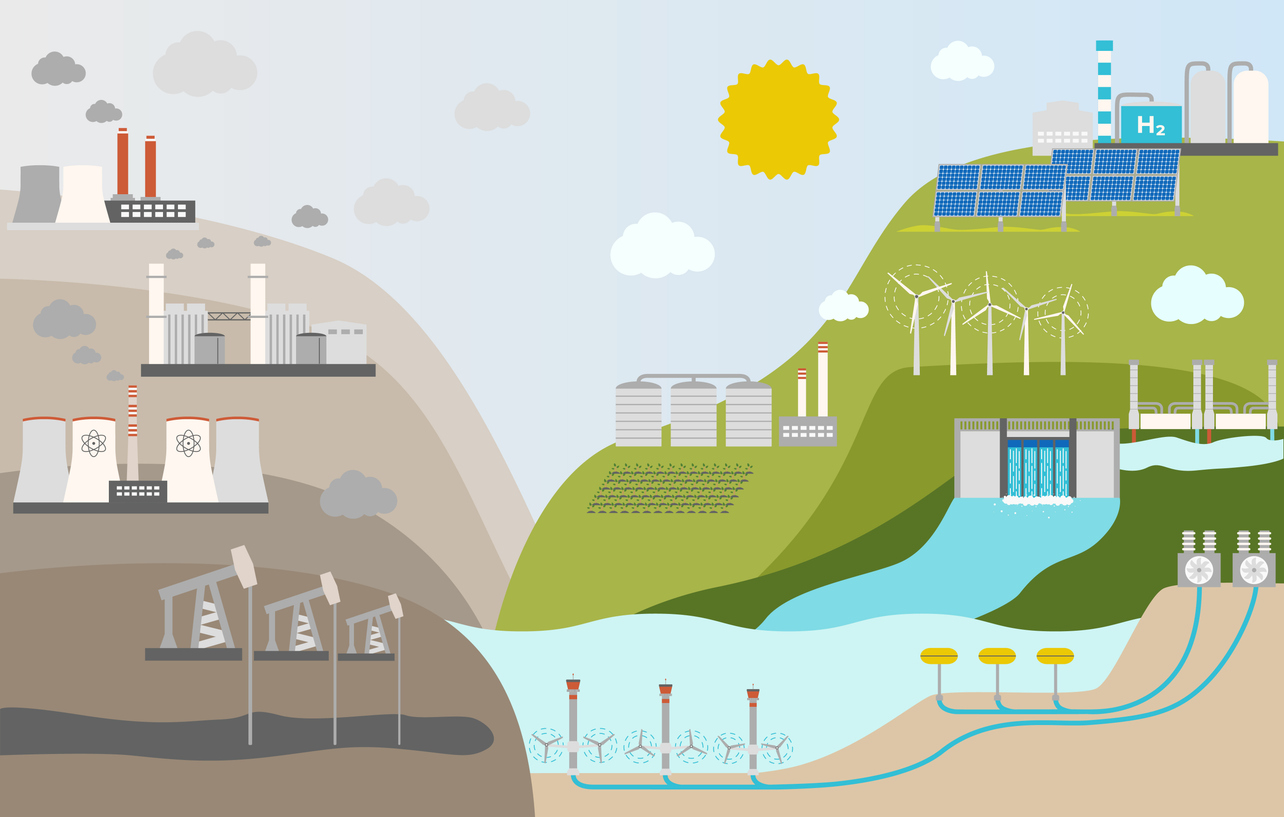
Portugal’s energy dependence has been declining, yet it remains a significant macroeconomic vulnerability. This fragility manifests across multiple dimensions: the risk to supply stability, its contribution to the trade balance and external financing needs. Additionally, exposure to fluctuations in benchmark prices affects the terms of trade and the real income of the economy. As Portugal is not a primary producer of oil or natural gas, its high degree of energy dependence renders it vulnerable to such fluctuations. Energy is a critical input for production and transport costs, with a direct impact on inflation and GDP: rising energy costs reduce households’ real disposable income and increase firms’ operating costs, penalising consumption and investment. Beyond the direct impact, higher energy costs compress corporate margins and raise transport costs, generating indirect effects that propagate through to inflation.
The 2022 energy crisis highlighted the vulnerability to disruptions in the energy supplies. The Russian Federation’s invasion of Ukraine resulted in a severe impact on the price of natural gas (a 320% increase between January and August 2022). Other industrial raw materials (e.g., fertilisers) and food products, whose production depends on this resource, also suffered significant contagion effects. This episode reinforced the debate around economic resilience, the diversification of energy sources and suppliers, and European industrial competitiveness itself.
| Chart 1: Energy dependence, % | Chart 2: Portugal’s percentile in the distribution of dependence among EU Member States |
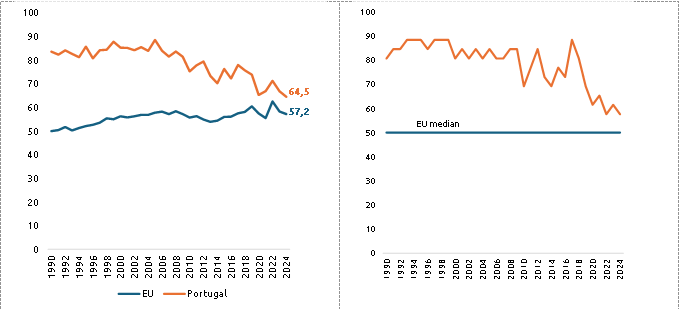
Source: Eurostat, CFP calculations. Note: The energy dependence ratio measures the share of total energy available for consumption in a territory, known as Gross Available Energy (GAE), that is met by imports. The EU values are not consolidated (they include imports between Member States and are therefore not directly comparable with those of an individual country).
Portugal’s energy dependence has declined steadily since 2005, in contrast with the EU. In Portugal, dependence fell from an average of 83.7% in the 1990s (52.3% in the EU) to 64.5% in 2024 (57.2% in the EU). Although still above the European average, the degree of dependence has been converging with the EU Member States’ median (Charts 1 and 2). In the 1990s, Portugal had the 4th highest dependence ratio and, by 2024, it had fallen to the 12th highest, a more favourable position than Spain (68.9%) and Germany (66.8%).
The degree of energy dependence has implications for public finances, increasing pressure on fiscal policy to intervene in price stabilisation. The consequences are concentrated primarily in the budgetary impact of subsidies and administrative price controls: measures that tend to discourage energy saving and, when not targeted, to generate regressive redistributive effects, disproportionately benefiting higher-income groups. In 2022, reductions in the excise duty on petroleum products (ISP) and a suspension of carbon tax updates were implemented (the CFP Report sets out these support measures in detail). In that context, extraordinary support payments to lower-income households represent an example of targeted intervention. Between 2022 and 2023, the budgetary impact of measures responding to the energy shock amounted to €6,800 million (2.6% of GDP), of which 40% corresponded to fiscal changes on fuels. This impact does not include the indirect operation of automatic stabilisers.
Portuguese energy imports are concentrated among a limited number of suppliers. Between 2015 and 2019, prior to the 2022 crisis, the composition of oil and petroleum product imports was concentrated among the following suppliers: Russia (15%), Angola (13%), Spain (11%), Azerbaijan (9%), and Saudi Arabia (9%). In 2024 and 2025, more than half of these imports originated from three countries: Brazil (26%), Spain (17%), and Algeria (12%). In the case of natural gas, concentration is currently even more pronounced: Nigeria (42%) and the United States (38%), whereas in 2017, the main suppliers were Spain (50%) and Qatar (11%).
| Chart 3: Gross available energy, 1990 = 100 | Chart 4: Sectoral evolution of energy consumption and energy intensity, 1995–2024 |
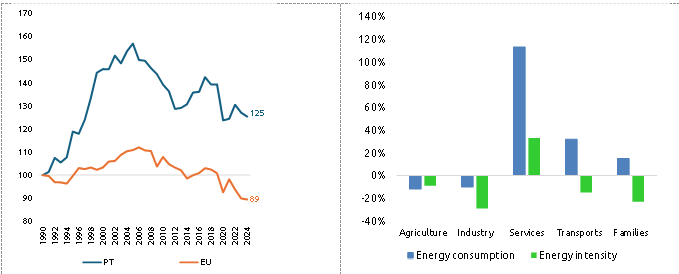
| Source: Eurostat, CFP calculations. | Source: DGEG, CFP calculations. |
The reduction in the degree of dependence occurred alongside a decline in energy consumption since the mid-2000s. In Portugal, GAE peaked in 2005, having risen by 60% relative to 1990, but had fallen to 25% above 1990 levels by 2024 (Chart 3). In the EU, GAE peaked in 2006 (12% above 1990) and has been declining since. Alongside this reduction, a sectoral rebalance in energy use has taken place. Based on data from the Directorate-General for Energy and Geology (DGEG), between 1995 and 2024, reductions were recorded in agriculture (-12%) and industry (-10%), while increases occurred in households (15%), transport (32%), and services (113%) (Chart 4).
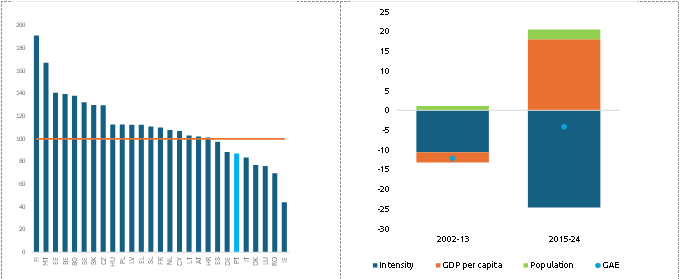
The energy intensity of the Portuguese economy also exhibits a declining trend. This indicator measures the units of energy consumed per million euros of GDP, and is frequently used as a proxy for the energy efficiency of an economy. In 2024, each unit of output required 12.9% less energy consumption in Portugal compared to the EU (Chart 5). Drawing on an IMF (2019) approach, it is possible to decompose energy consumption into its main components (Chart 6).
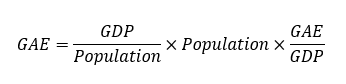
This formulation shows that, despite the significant increase in GDP per capita over the period (42%) and population growth (7%), the reduction in energy intensity (-31%) reversed the trajectory of GAE. At the sectoral level, the reduction in energy intensity was most pronounced in industry (-29%) and households (-23%), smaller in agriculture and fisheries (-9%) and transport (-15%), with only the services sector recording both an increase in consumption and in intensity (33%). The rise in energy intensity in the services sector may be influenced by tourism growth, air conditioning, and, in the future, data centres.
| Chart 5: Energy intensity in 2024, EU average = 100 (Terajoules per M€) | Chart 6: Contributions to the change in GAE, p.p. |
| Source: DGEG, CFP calculations. | Source: Eurostat, CFP calculations. |
The reduction in the energy intensity of economic activity helps to mitigate the economic impact of raw material price shocks. According to international trade statistics, the energy trade deficit in 2024 amounted to 2.1% of GDP, compared to an average of 3% of GDP since 2000. Had the dependence ratio remained at 2005 levels, the trade balance would have deteriorated by approximately 40% more (equivalent to 1% of GDP in 2024).
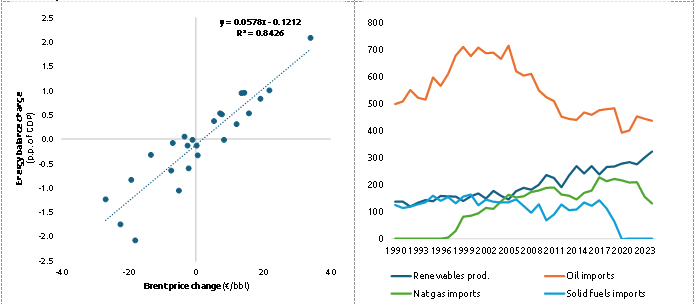
Over the past 25 years, a €10 increase in the price of a barrel of Brent crude has been associated with a deterioration of the energy trade balance of around 0.6% of GDP. The most striking example was observed in 2022, during the energy crisis, when a €34 increase in the price per barrel of Brent led to a trade balance deterioration equivalent to 2.1% of GDP (€5,800 million), generating a significant transfer of income abroad (Chart 7). The greater dispersion observed during periods of price declines is consistent with the coincidence of these declines with periods of economic contraction, during which the simultaneous reduction in energy demand unevenly attenuates the price effect on the trade balance. It should be noted that this exercise does not account for the impact that other raw materials, such as natural gas, may have had on the energy trade balance.
| Chart 7: Correlation between the annual change in the energy trade balance and the Brent price | Chart 8: Share of each component in GAE |
| Source: CFP calculations. | Source: Eurostat, CFP calculations. |
Primary energy production in Portugal has more than doubled since 2005, now representing over 35% of GAE. The reduction in energy dependence was made possible by the simultaneous contribution of lower consumption, reduced energy intensity, and gains in domestic energy production. The increase in domestic production is essentially attributable to the growth (122%) in renewable energy sources (Chart 8). This is a differentiating factor: in the EU, dependence increased alongside an absolute reduction in domestic production. Given the persistence of a high level of dependence and the absence of domestic fossil resources, greater penetration of renewable production and electrification of consumption will be necessary to mitigate the risks that price volatility poses to the economy and public finances. In this regard, the National Energy and Climate Plan 2030 (PNEC) is the principal energy and climate policy instrument: in its November 2024 update, the energy dependence target for 2030 was 65% — a figure that appears to have been reached in 2024.
Despite the progress achieved, approximately two-thirds of the energy available in Portugal still depends on imports, concentrated among a limited number of suppliers. The experience of the 2022 crisis, with policy measures carrying a budgetary impact of €6,800 million, demonstrated the cost of this vulnerability. The findings presented here underscore the importance of a strategy that combines investment in renewables with the promotion of sectoral energy efficiency, particularly in services.
The blockade of the Strait of Hormuz materialised the risk of a new energy shock. The Brent price rose from approximately €60/barrel at the start of 2026 to above €90/barrel in March, in the wake of the Middle East conflict. Based on the estimated elasticity, an increase of this magnitude (in the order of €30/barrel) could result in a deterioration of the energy trade balance of around 1.8% of GDP, comparable to the impact observed in 2022. The gains in energy autonomy achieved over the past two decades represent a significant buffer, but one that remains insufficient in the face of shocks of this magnitude.
Note: This analysis adapts to the national context the approach proposed by Sterling et al. (2025).
References
Kilian, L. (2008). The Economic Effects of Energy Price Shocks. Journal of Economic Literature, 46(4), 871-909
Anaya Longaric, P., De Sanctis, A., Grynberg, C., Kostakis, V., & Vinci, F. (2024). Energy shocks, corporate investment and potential implications for future EU competitiveness. ECB Economic Bulletin, Issue 8/2024.
Conselho das Finanças Públicas. (2024). Evolução Orçamental das Administrações Públicas em 2023 (Relatório N.º 05/2024).
International Monetary Fund (2019). “What’s happening with global carbon emissions?”. World Economic Outlook, Box 1, October.
Agência Portuguesa do Ambiente. (2024, outubro). Plano Nacional Energia e Clima 2030 (PNEC 2030). Update/revision.
Date of last update: 08/04/2026
About this Blog
Contraciclo is a forum for the views of the Portuguese Public Finance Council (CFP) staff and members on economic issues. The views expressed are those of the author(s) and do not necessarily represent the views of the CFP. Therefore, they cannot be attributed to the CFP or to the Senior Board under no circumstances.


