
 Calendar
 Newsletter



Concerns surrounding China’s “industrial mercantilism” have gained prominence in the European political sphere. This debate has intensified as the trade relationship with the EU becomes more unbalanced (Chart 1) and the risk of deindustrialisation more evident. The root cause of China’s significant balance of payments surpluses lies in the delay in the transition from an economic growth model based on investment to one anchored in domestic consumption.[1] Currently, all EU Member States have trade deficits with China, with Germany having seen a particularly marked turn in its trade balance.[2]
Chart 1 – China’s growing dominance in international trade
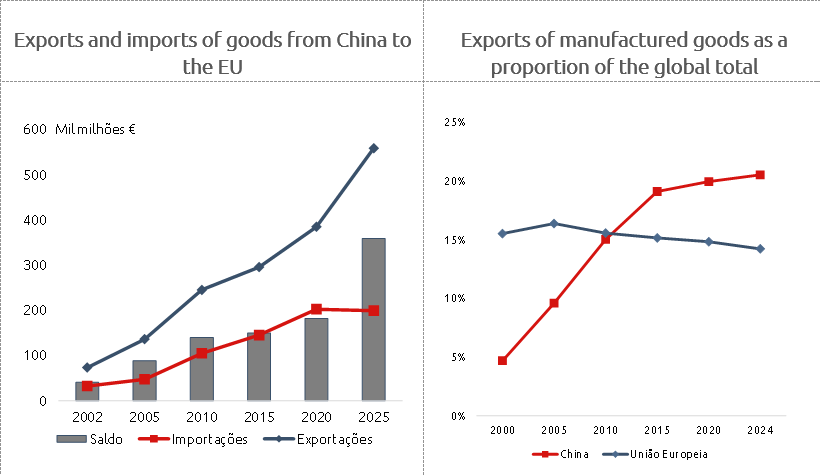
Sources: Left-hand panel, Eurostat, CFP calculations; Right-hand panel, WTO Stats, CFP calculations. Note: Left-hand panel, China excluding Hong Kong; Right-hand panel, European Union corresponds to extra-EU exports.
Excess industrial capacity in the Chinese economy has been exacerbated by policies providing subsidies to boost production. This combination of factors has exerted downward pressure on the prices of manufactured goods in international markets, resulting in disruptions in some of the EU’s key industrial sectors. The competitiveness of European producers is also hampered by the lack of a freely floating yuan exchange rate, a factor that has boosted the competitiveness of Chinese goods.[3]. A recent analysis by the Fed found evidence of a systemic link, across different sectors, between state interventions in industrial policy and the evolution of China’s exports and import substitution.[4] This phenomenon, linked to the increase in value added and the sophistication of competition from Chinese producers, is particularly evident in the automotive market, renewable energy technologies, and the chemical, steel and aluminium industries. The tariffs imposed by the US in 2025 have encouraged Chinese companies to redirect their exports.[5]
This scenario, referred to as ‘the second China shock’, differs from the first shock[6] in that the substantial increase in exports is now concentrated in higher-tech sectors. Between 2000 and 2024, the share of Chinese exports of non-energy industrial goods in the global total more than quadrupled (Chart 1). The impact of the current shock is increasingly viewed through the lens of economic security and, as such, the European Commission has stepped up its use of trade defence instruments to protect domestic industries from what it identifies as unfair and subsidised competition. Examples include the imposition of customs duties on electric vehicles and sector-specific investigations, notably into subsidies granted to Chinese tyre manufacturers, and the introduction of the Carbon Border Adjustment Mechanism. These measures form part of the Economic Security Strategy of June 2023, which focuses on reducing dependence and exposure to four types of risk: supply chain resilience, the physical and cyber security of critical infrastructure, technological security, and the exploitation of economic dependencies.
The degree of vulnerability of Portuguese exports to the ‘Great Wall’ of Chinese exports[7] can be approximated in the light of the concept of comparative advantages. Comparative advantages refer to a country’s ability to produce certain goods or services at a relatively lower cost than other countries, not necessarily in absolute terms, but in terms of opportunity cost. According to classical international trade theory, even if a country is less efficient in the production of all goods, it can still benefit from international trade by specialising in what it is relatively more efficient at.
For this purpose, the index of revealed comparative advantages by exported product, provided by UNCTAD, is used. In its calculation, the share of a good in a country’s exports is compared with the share of that same good in global exports, thereby revealing the relative specialisation of that economy in that good. In practical terms, we can say that an economy has a revealed comparative advantage in a sector when the index value is greater than 1. Although this indicator can provide a general indication of a country’s comparative advantages in exports, its formula does not take into account other measures that affect competitiveness (tariffs, non-tariff barriers or subsidies).
Over the last 25 years, the number of product categories in which European and Chinese economies share specialisation has grown significantly.[8] This evidence of growing Chinese competition challenges the export-oriented European growth model. In the case of the Portuguese economy, the analysis shows that the number of products with shared specialisation rose from 36 in 2000 to 52 in 2024, whilst in the case of the German economy, this figure more than doubled, rising from 21 to 53 (Chart 2). Among the Portuguese exports examined, around 75% belong to the manufactured goods group, evidence of the industrial nature of the Chinese economy. At the same time, it is clear that the growth of Chinese competition vis-à-vis the German economy is concentrated in the machinery and transport equipment group, which was not the case in 2000.
Chart 2 – The rise in competition from Chinese exports
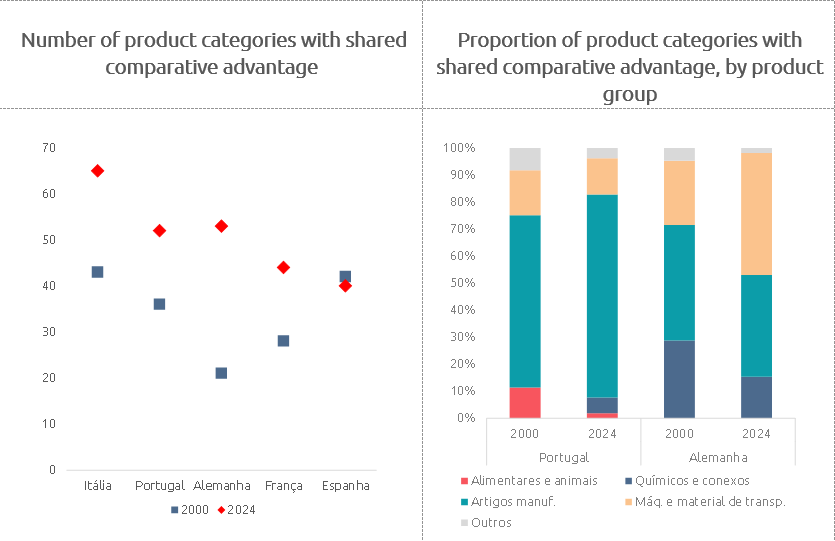
Source: UNCTAD; CFP calculations. Note: Left-hand panel: the chart shows the number of product categories for which the revealed comparative advantage index is greater than 1 for both the country and China. If both economies specialise in the same product category, it is likely that exports of that product are competing directly with one another. There are 259 product categories.
Among the product categories in which the Portuguese economy has the highest level of specialisation, those currently standing out are those related to cork, olive oil, leather, glass and paper. Since 2000, the number of products for which the Portuguese economy has a comparative advantage has grown from 75 to 102. During the period, the products with the greatest gains in competitiveness were cork, radio receivers, and meters and measuring instruments. Conversely, the products that suffered the greatest deterioration in competitiveness were textiles, footwear (two examples affected by the initial impact of China) and electrical power distribution equipment. By product group, the largest increases were observed in ‘food products and live animals’ and in manufactured goods. If we consider products with a revealed comparative advantage index above 3, the increase was 8, concentrated in manufactured goods (e.g. tyres).
Added to this structural shift in global trade is the economic policy of the US administration, with the rise in tariff barriers and the normalisation of uncertainty. A recent analysis by the Bank of Portugal found evidence of a contraction in the volume of exports to the US, in relative terms, as well as, in a broader sense, a reduction in the market shares of Portuguese exports in 2025, following the gains observed over the last decade. The reorientation of Portuguese exports towards other markets will present increased challenges given their profile of specialisation and differentiation. A possible response to these strategic challenges will lie in the opportunities created by a deepening of the European single market, in line with the recommendations of the Letta and Draghi Reports. The growth potential is significant, given that, according to the ECB, there are internal barriers that increase the costs of trading goods by 67% and the costs of trading services by 95% compared to domestic costs, compounded by barriers in the capital market – which is crucial for financing investment – and in digital services, which are fundamental to innovation and productivity.
(This analysis forms part of Report 02-2026 of the Portuguese Public Finance Council, “Economic and Fiscal Outlook 2026–2030”)
[1] This is also linked to the lingering effects of the property crisis that began in late 2021.
[2] In part, the deterioration in the trade balances with China is driven by the EU’s difficulties in offsetting the growth in imports with exports of high value-added services.
[3] According to the German Economic Institute (IW), the real exchange rate of the yuan against the euro, based on the producer price index, depreciated by approximately 30% between January 2020 and April 2025.
[4] de Soyres, F., Fisgin, E., Liu, M., & Van Leemput, E. (2026, March 2023). China's trade dominance and the role of industrial policies. FEDS Notes. Board of Governors of the Federal Reserve System.
[5] Le Roux, J., Spital, T. (2026). ‘Global trade redirection: tracking the role of trade diversion from US tariffs in Chinese export developments’. ECB Economic Bulletin 1/2026.
[6] Motivated by China’s accession to the World Trade Organisation in 2001 and relying on cheap labour, in the initial phase Chinese private firms, in collaboration with multinationals, transformed China into the world’s factory (e.g. textiles, footwear and electronic goods).
[7] The Great Wall of Chinese goods: The effect of tariff-induced re-routing on euro area consumer prices | CEPR.
[8] By standard classification for international trade.
Date of last update: 11/05/2026


